Summary
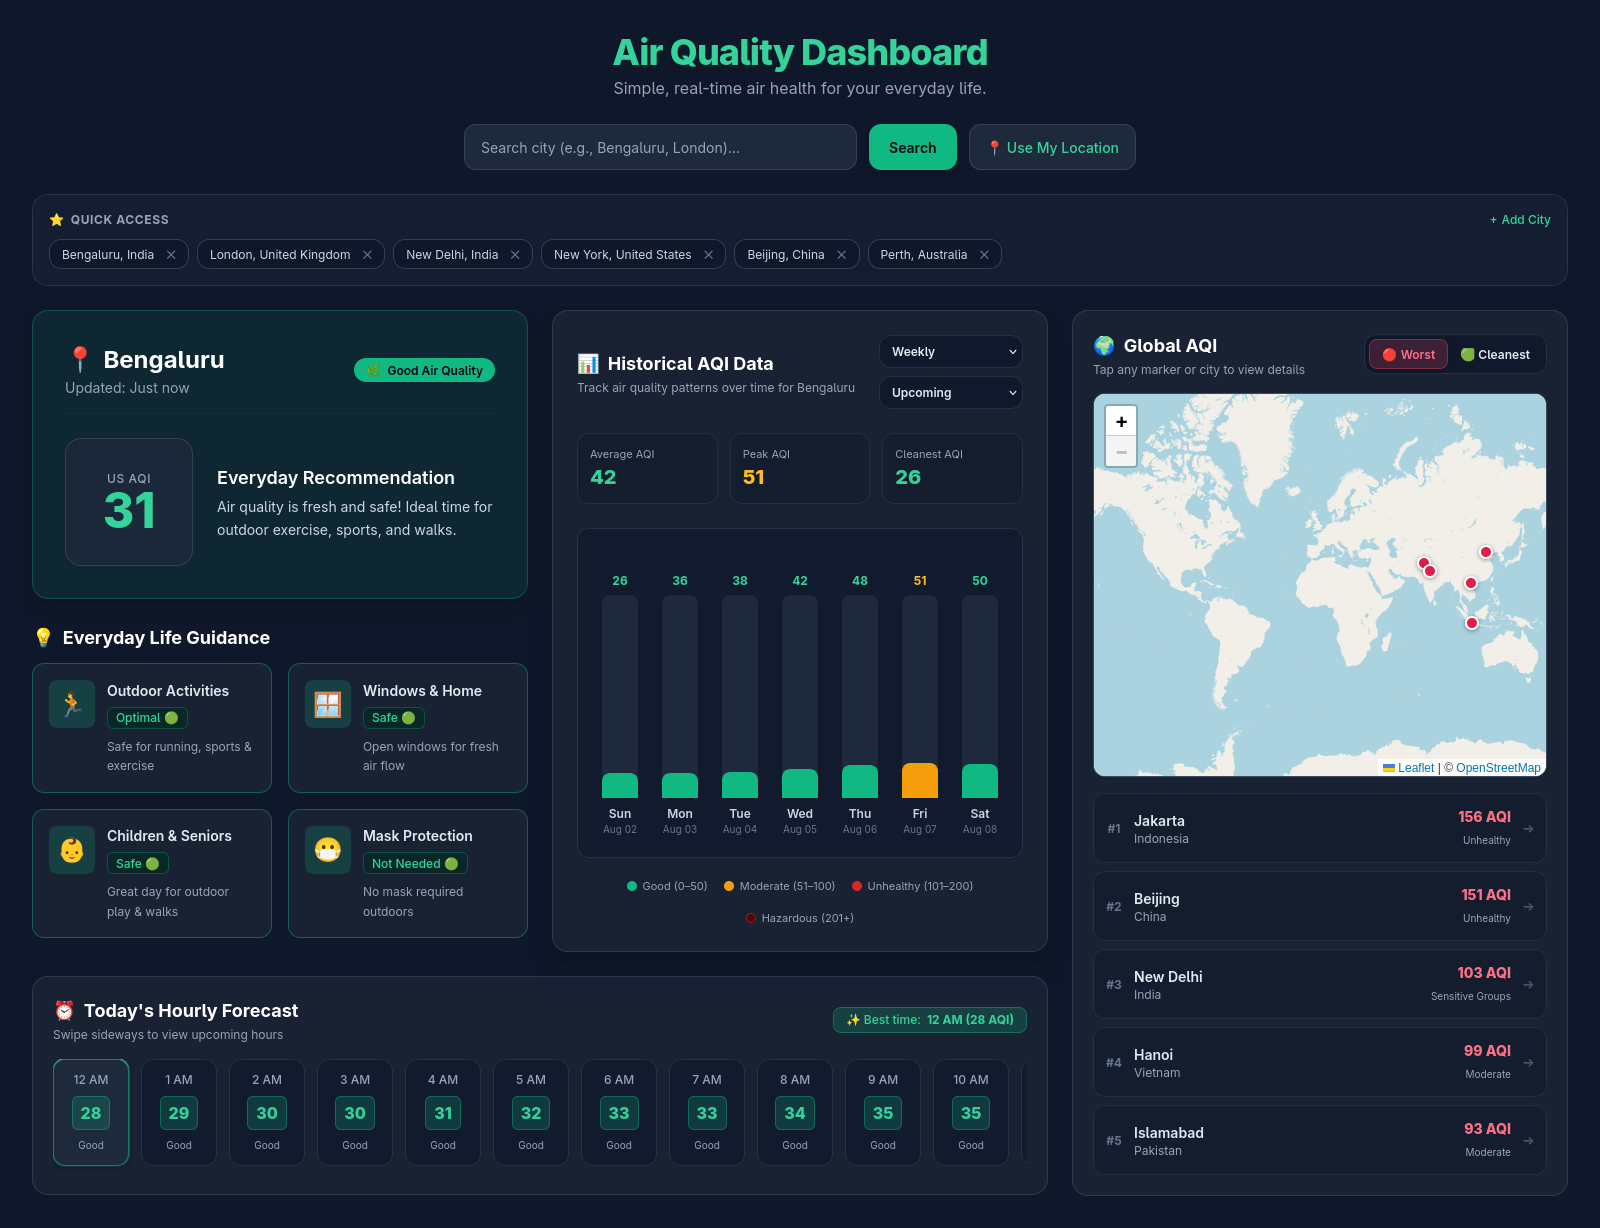
This project outlines the end-to-end architecture, technical problem-solving, and UI/UX decision-making behind a production-grade Global Air Quality Intelligence Dashboard.
Built with React, Tailwind CSS, and Leaflet, the dashboard combines real-time geographic mapping, dynamic metric calculations, and multi-source API integration into a clean, minimalist, and responsive user experience.
Problem Statement & User Experience Goals
Modern weather and environmental applications often suffer from visual clutter, confusing data scaling, and slow rendering maps.
Core Objectives:
- Real-Time Data Clarity: Display live Air Quality Index (AQI) metrics alongside historical and forecast patterns.
- Geospatial Interaction: Provide an interactive world map highlighting global extremes (cleanest vs. worst cities).
- Minimalist Aesthetics: Implement a dark-mode, card-based layout inspired by modern design systems, optimizing for readability and zero cognitive overload.
- Component Modularity: Isolate logic into self-contained React modules with robust error handling and smooth fallback states.
Technical Architecture & Tech Stack
- Frontend Library: React (Functional components, Hooks:
useState,useEffect) - Styling: Tailwind CSS (Utility-first, responsive grids, custom scrollbars and states)
- Mapping Engine: React-Leaflet & Leaflet (Custom marker icons, dynamic tile rendering fixes)
- APIs Used:
- Open-Meteo Air Quality API (Live US AQI, hourly forecasts, past data)
- Open-Meteo Geocoding API (Dynamic city-to-coordinate resolution)
- OpenStreetMap (Tile layers)
The Engineering Process
- Component Scaffolding & Dummy Data: started by building out clean, modular UI cards (
GlobalExtremes,AqiTrends) using static mock data to lock in the minimalist dark-mode aesthetics and layout structure. - Global State via Selected City Context: established a centralized React context (
SelectedCity) so that clicking any city on the global map or search bar instantly propagates coordinates across all dashboard widgets. - Live API Integration: replaced the static mocks with asynchronous calls to the Open-Meteo Air Quality and Geocoding APIs, feeding real-time hourly metrics, weekly trends, and dynamic scale computations straight into the front-end.
1. Building Components & Using Dummy Data
To establish visual hierarchy and responsiveness before dealing with asynchronous latency, first engineered the UI containers with static fallback structures.
- Design Focus: Using Tailwind CSS (
bg-slate-800/60, rounded borders, subtle glow effects) to ensure high scannability and zero clutter. - Component Structure: Isolated self-contained cards like
GlobalExtremesandAqiTrendsto keep the codebase modular and maintainable.
// Initial component setup with structured state and mock-ready layout
export default function GlobalExtremes({ onSelectCity }) {
  const [activeTab, setActiveTab] = useState('worst');
  // Dummy data
  const [cities, setCities] = useState([]);

  return (
    <div className="w-full p-5 bg-slate-800/60 border border-slate-700/80 rounded-2xl">
      <h3 className="text-lg font-bold text-white">Global AQI</h3>
      {/* UI Elements & Map container */}
    </div>
  );
}
2. Creating Common Props & Shared SelectedCity Context
To make the dashboard interactive, user selections needed to flow seamlessly between independent widgets (e.g., clicking a city in the global extremes list updates the historical trends chart).
- The Solution: Implemented a React Context provider (
useSelectedCity) that wraps the application, holding state for latitude, longitude, and city name.
import React, { createContext, useContext, useState } from 'react';

const SelectedCityContext = createContext();

export function SelectedCityProvider({ children }) {
  const [selectedCity, setSelectedCity] = useState({
    city: 'Bengaluru',
    lat: 12.9716,
    lng: 77.5946
  });

  return (
    <SelectedCityContext.Provider value={{ selectedCity, setSelectedCity }}>
      {children}
    </SelectedCityContext.Provider>
  );
}

export const useSelectedCity = () => useContext(SelectedCityContext);
3. Fetching API Data & Feeding the Front-End
With the UI structured and global context in place, we integrated live data pipelines using useEffect hooks and asynchronous fetch requests to Open-Meteo.
- Coordinate Resolution: If a selected city lacks explicit latitude/longitude, our service automatically queries the Geocoding API first.
- Data Transformation: Raw hourly metrics are sliced, averaged into daily/weekly buckets, and mapped to semantic status color codes (
Good,Moderate,Unhealthy,Hazardous).
useEffect(() => {
  const fetchCityTrends = async () => {
    setLoading(true);
    try {
      const res = await fetch(
        `aqi api call`
      );
      const data = await res.json();

      // Process hourly data into frontend-ready state
      const processedDays = processHourlyToDaily(data.hourly);
      setTrendData(processedDays);
    } catch (err) {
      console.error("API fetch error:", err);
    } finally {
      setLoading(false);
    }
  };

  fetchCityTrends();
}, [selectedCity]);
Key Engineering Works
- Defensive Programming: Implemented robust fallback logic for missing geolocation coordinates and API latency (loading skeletons and error boundaries).
- Performance Optimization: Minimized DOM re-renders by structuring state cleanly and utilizing lightweight Leaflet div-icons.
- Design System Consistency: Maintained strict adherence to Tailwind’s slate color palette combined with semantic status color-coding (
emerald,amber,rose).